Machine Learning Interpretability in Proteomics


Machine learning is an important frontier in proteomics-based diagnostics. But how good are these models if we cannot explain them?
This article explains why interpretability matters in proteomics and how TabPFN can help. We argue that interpretability is critical to build better models, understand predictions, advance scientific research, and meet regulatory requirements.
⚠️ All the data and plots shown in this article are generated for illustrative purposes. Nothing in this article constitutes medical advice.
A quick reminder: what is proteomics?
Proteomics is the large-scale study of proteins.[1] The proteome is the set of proteins expressed by a cell, tissue, or organism under specific conditions. The word “proteome” combines “protein” and “genome.” Proteins are large molecules made from amino acids.
By studying proteins circulating in a patient’s bloodstream, we can learn about a patient’s health. With sufficiently advanced machine learning methods, we can use these measurements to support the early detection of diseases, including certain cancers.[2]
This machine learning problem is particularly challenging because there are so many proteins. In many cases, the number of measured features far exceeds the number of training samples. In these scenarios, many traditional models struggle with the curse of dimensionality. TabPFN however can generate strong predictions on small datasets with a large number of features.
But with so many features, understanding how the model works becomes even more challenging.
What is interpretability?
Interpretability is about understanding how a model generates predictions. It answers questions such as:
- Which features does the model use?
- What is the relationship between these features and the predictions?
- What measurements drive a given prediction?
In proteomics, we may be tempted to focus on the final output: the prediction. If we can detect cancer early, why should we care about interpretability? Interpretability alone will not cure more patients. But what if it could help?
Interpretability for proteomics
Model building
Interpretability helps you understand how and why a model generates predictions; and which features it relies on. If a model relies heavily on a single protein, this may indicate a genuine biomarker, data leakage, confounding, or a need for more diverse training examples.
Further scientific research
Machine learning models can discover patterns in observational data that help researchers generate hypotheses.
Suppose a model uses a combination of ten proteins to detect cancer. This association could point to a biological mechanism worth investigating through further analysis and experimentation.
These associations do not establish causality, but they may offer clues about underlying biological processes.
Diagnosis explanations
Health professionals and patients often want to know why. Why did the model make a given prediction? Should we perform additional tests?
Audit requirements
In regulated domains such as healthcare and banking, machine learning systems are often subject to transparency, documentation, and audit requirements. Relevant frameworks include the GDPR, the EU AI Act for high-risk applications, and FDA guidance on transparency for Software as a Medical Device. Predictive performance alone is not enough in high-stakes settings.
Interpretability with TabPFN
Which features does the model use?
With TabPFN, you can compute SHAP values. These values estimate each feature’s contribution to a prediction relative to a baseline. A SHAP value with a large absolute magnitude means that the feature strongly influenced the prediction.
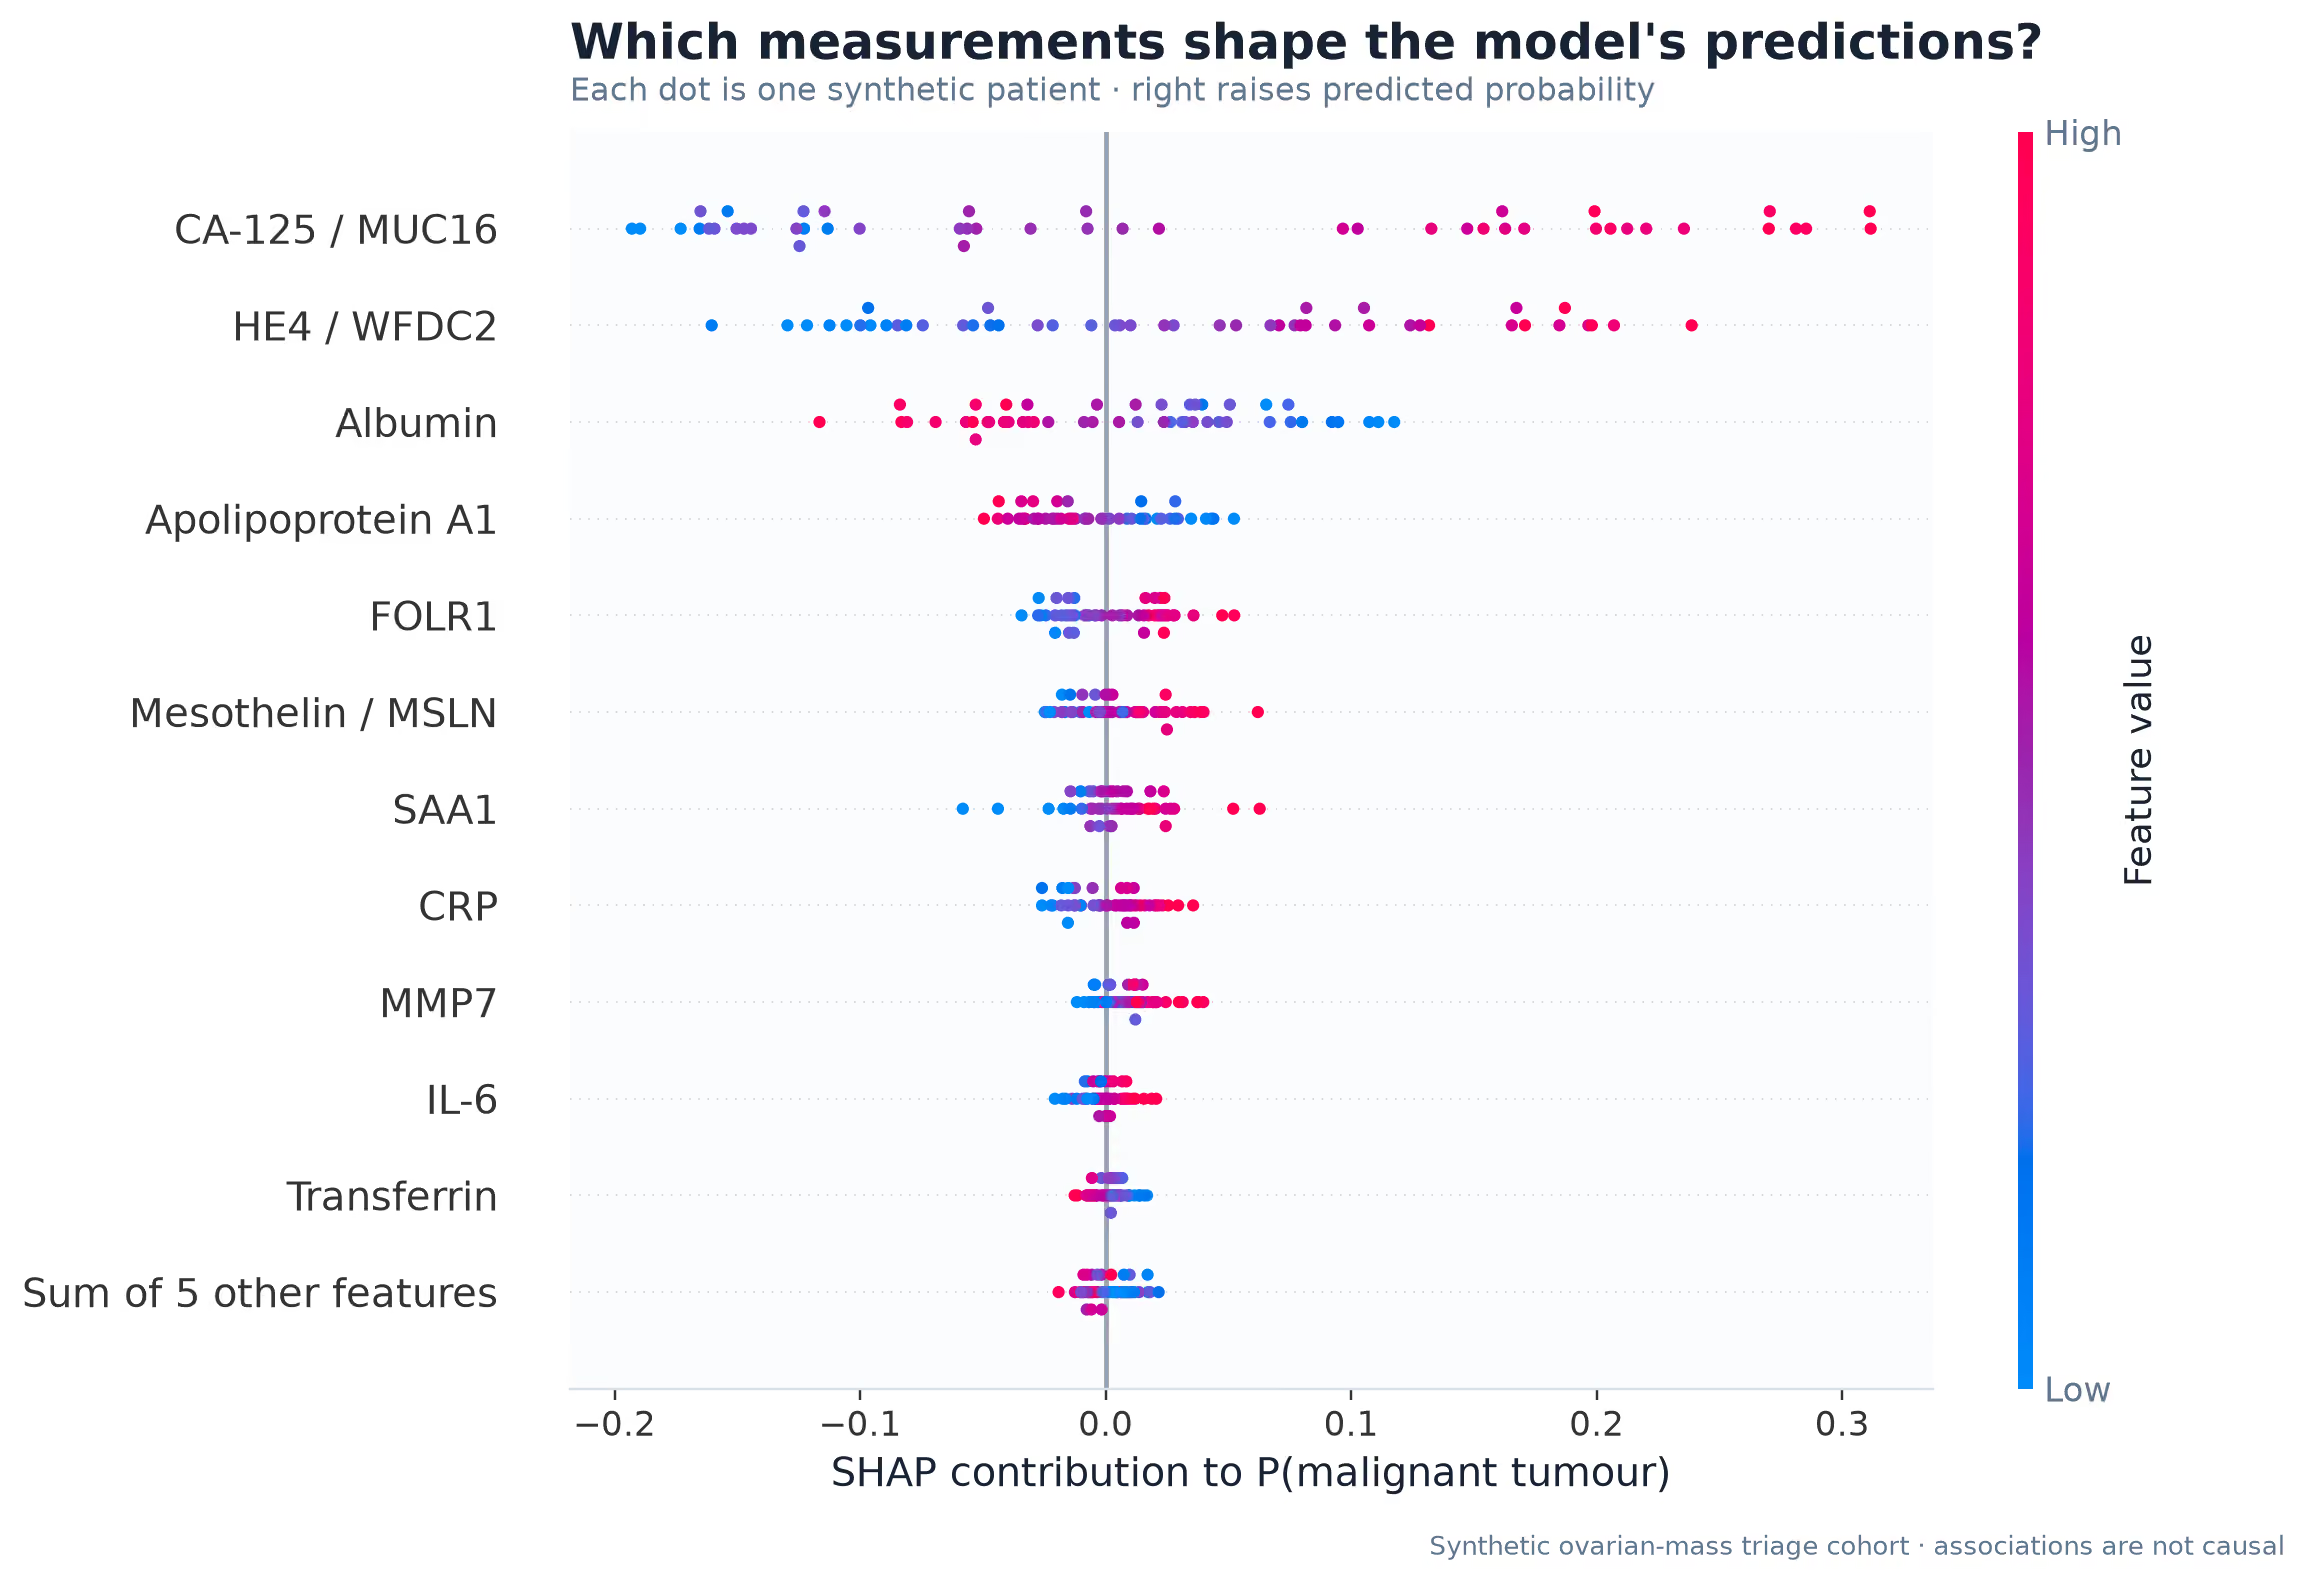
In this plot, features are ranked by their average absolute contribution to the model’s predictions. SHAP values explain model behavior but do not establish biological causality. You can learn more about SHAP values with TabPFN here.[3]
What is the relationship between these features and predictions?
To better understand the relationship between certain feature values and a model’s predictions, we can use partial dependence plots (PDPs).
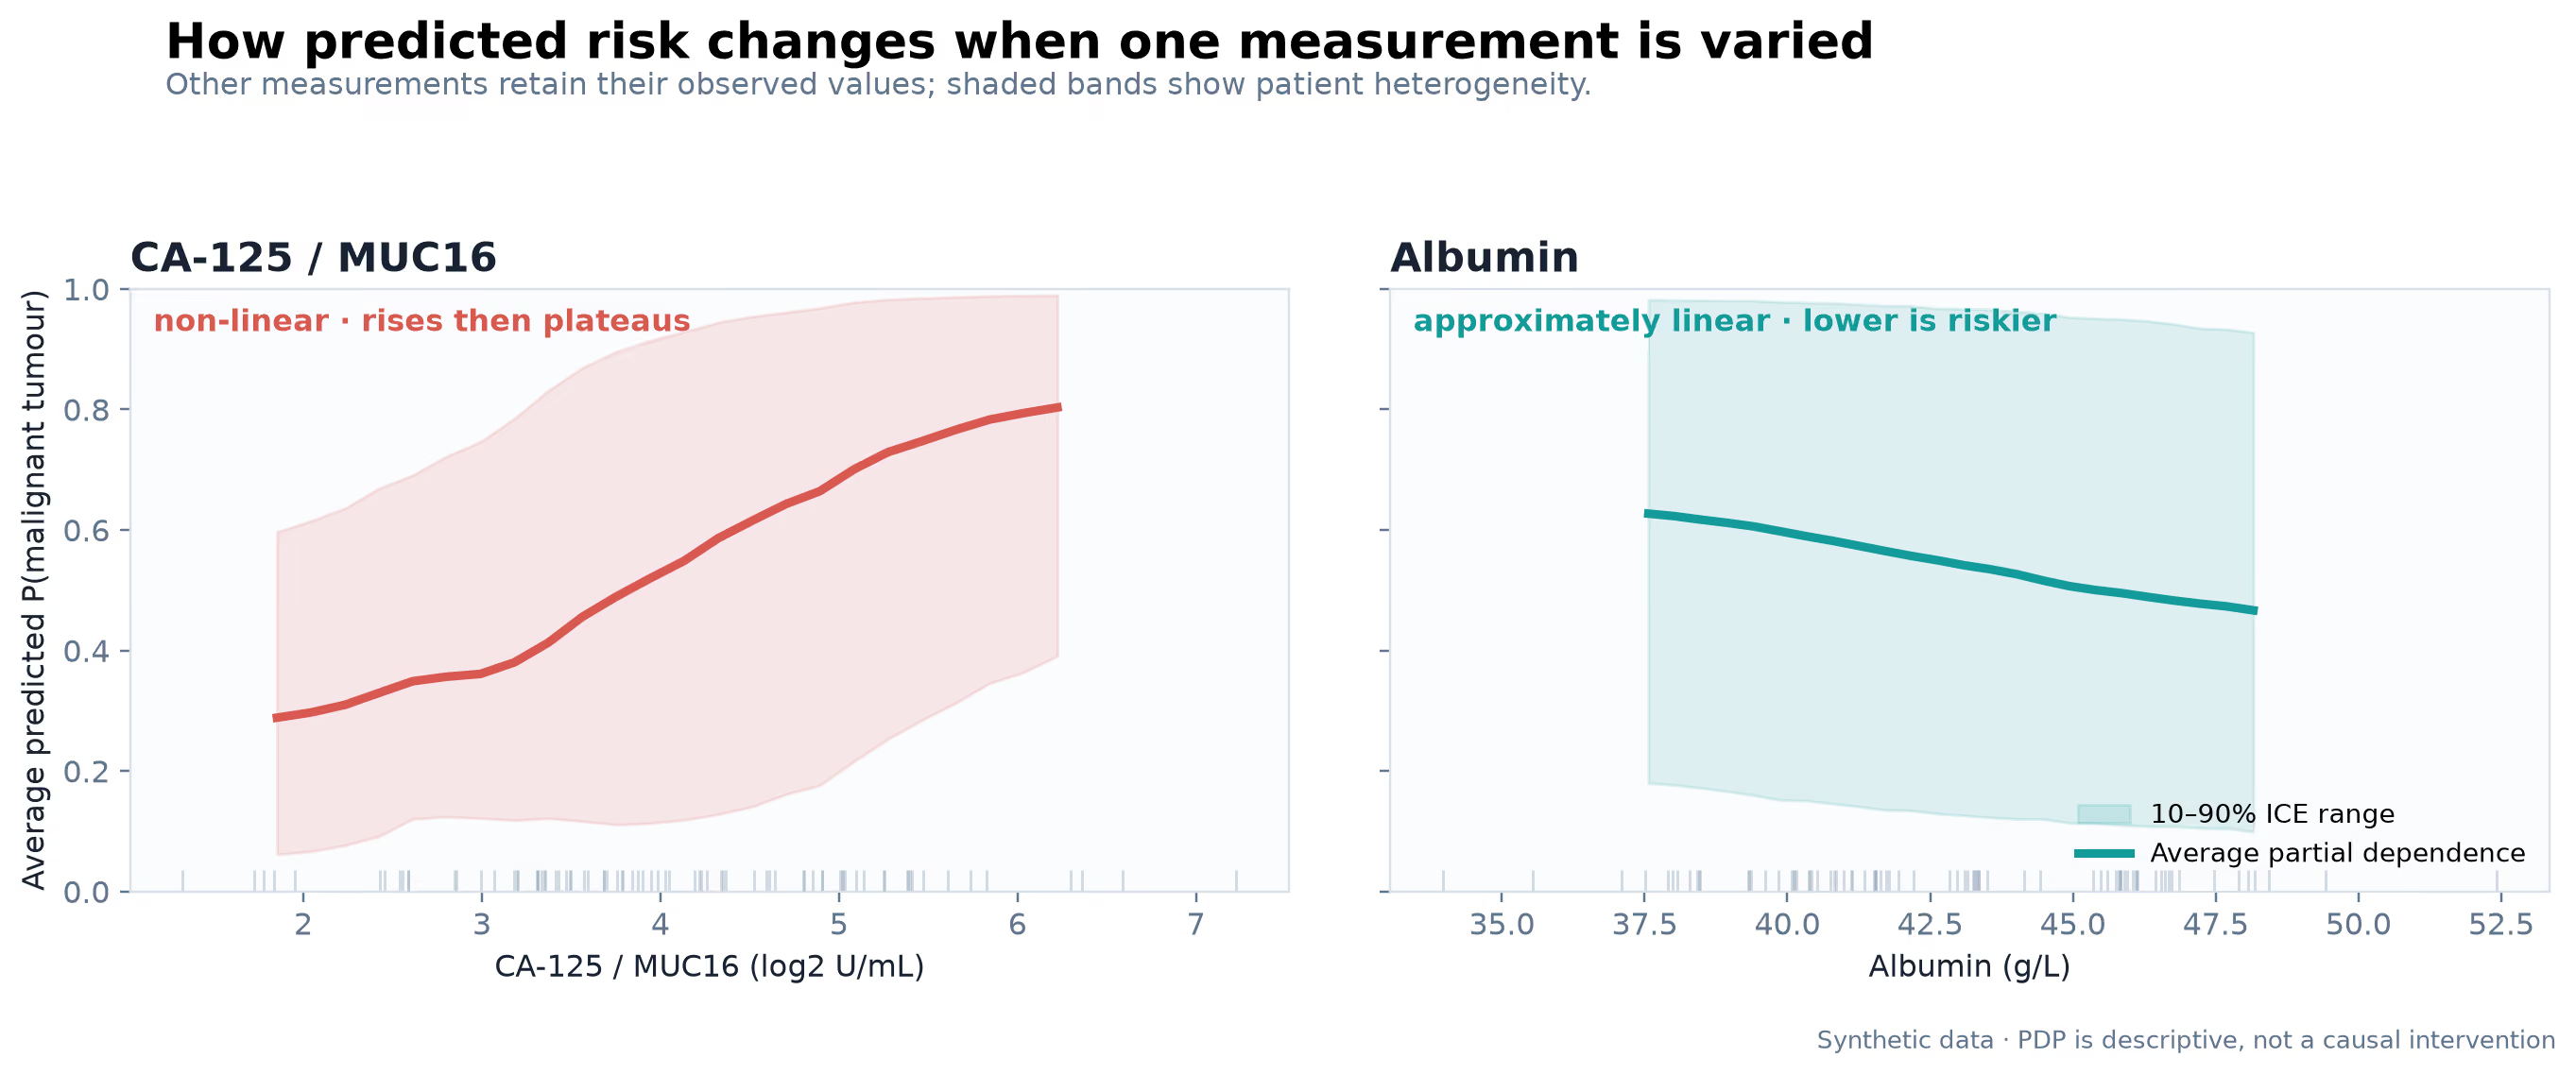
PDPs vary a feature and average the resulting predictions over the observed values of the other features. They can illustrate both linear and non-linear relationships, although correlated features require careful interpretation.
Why was a given prediction made?
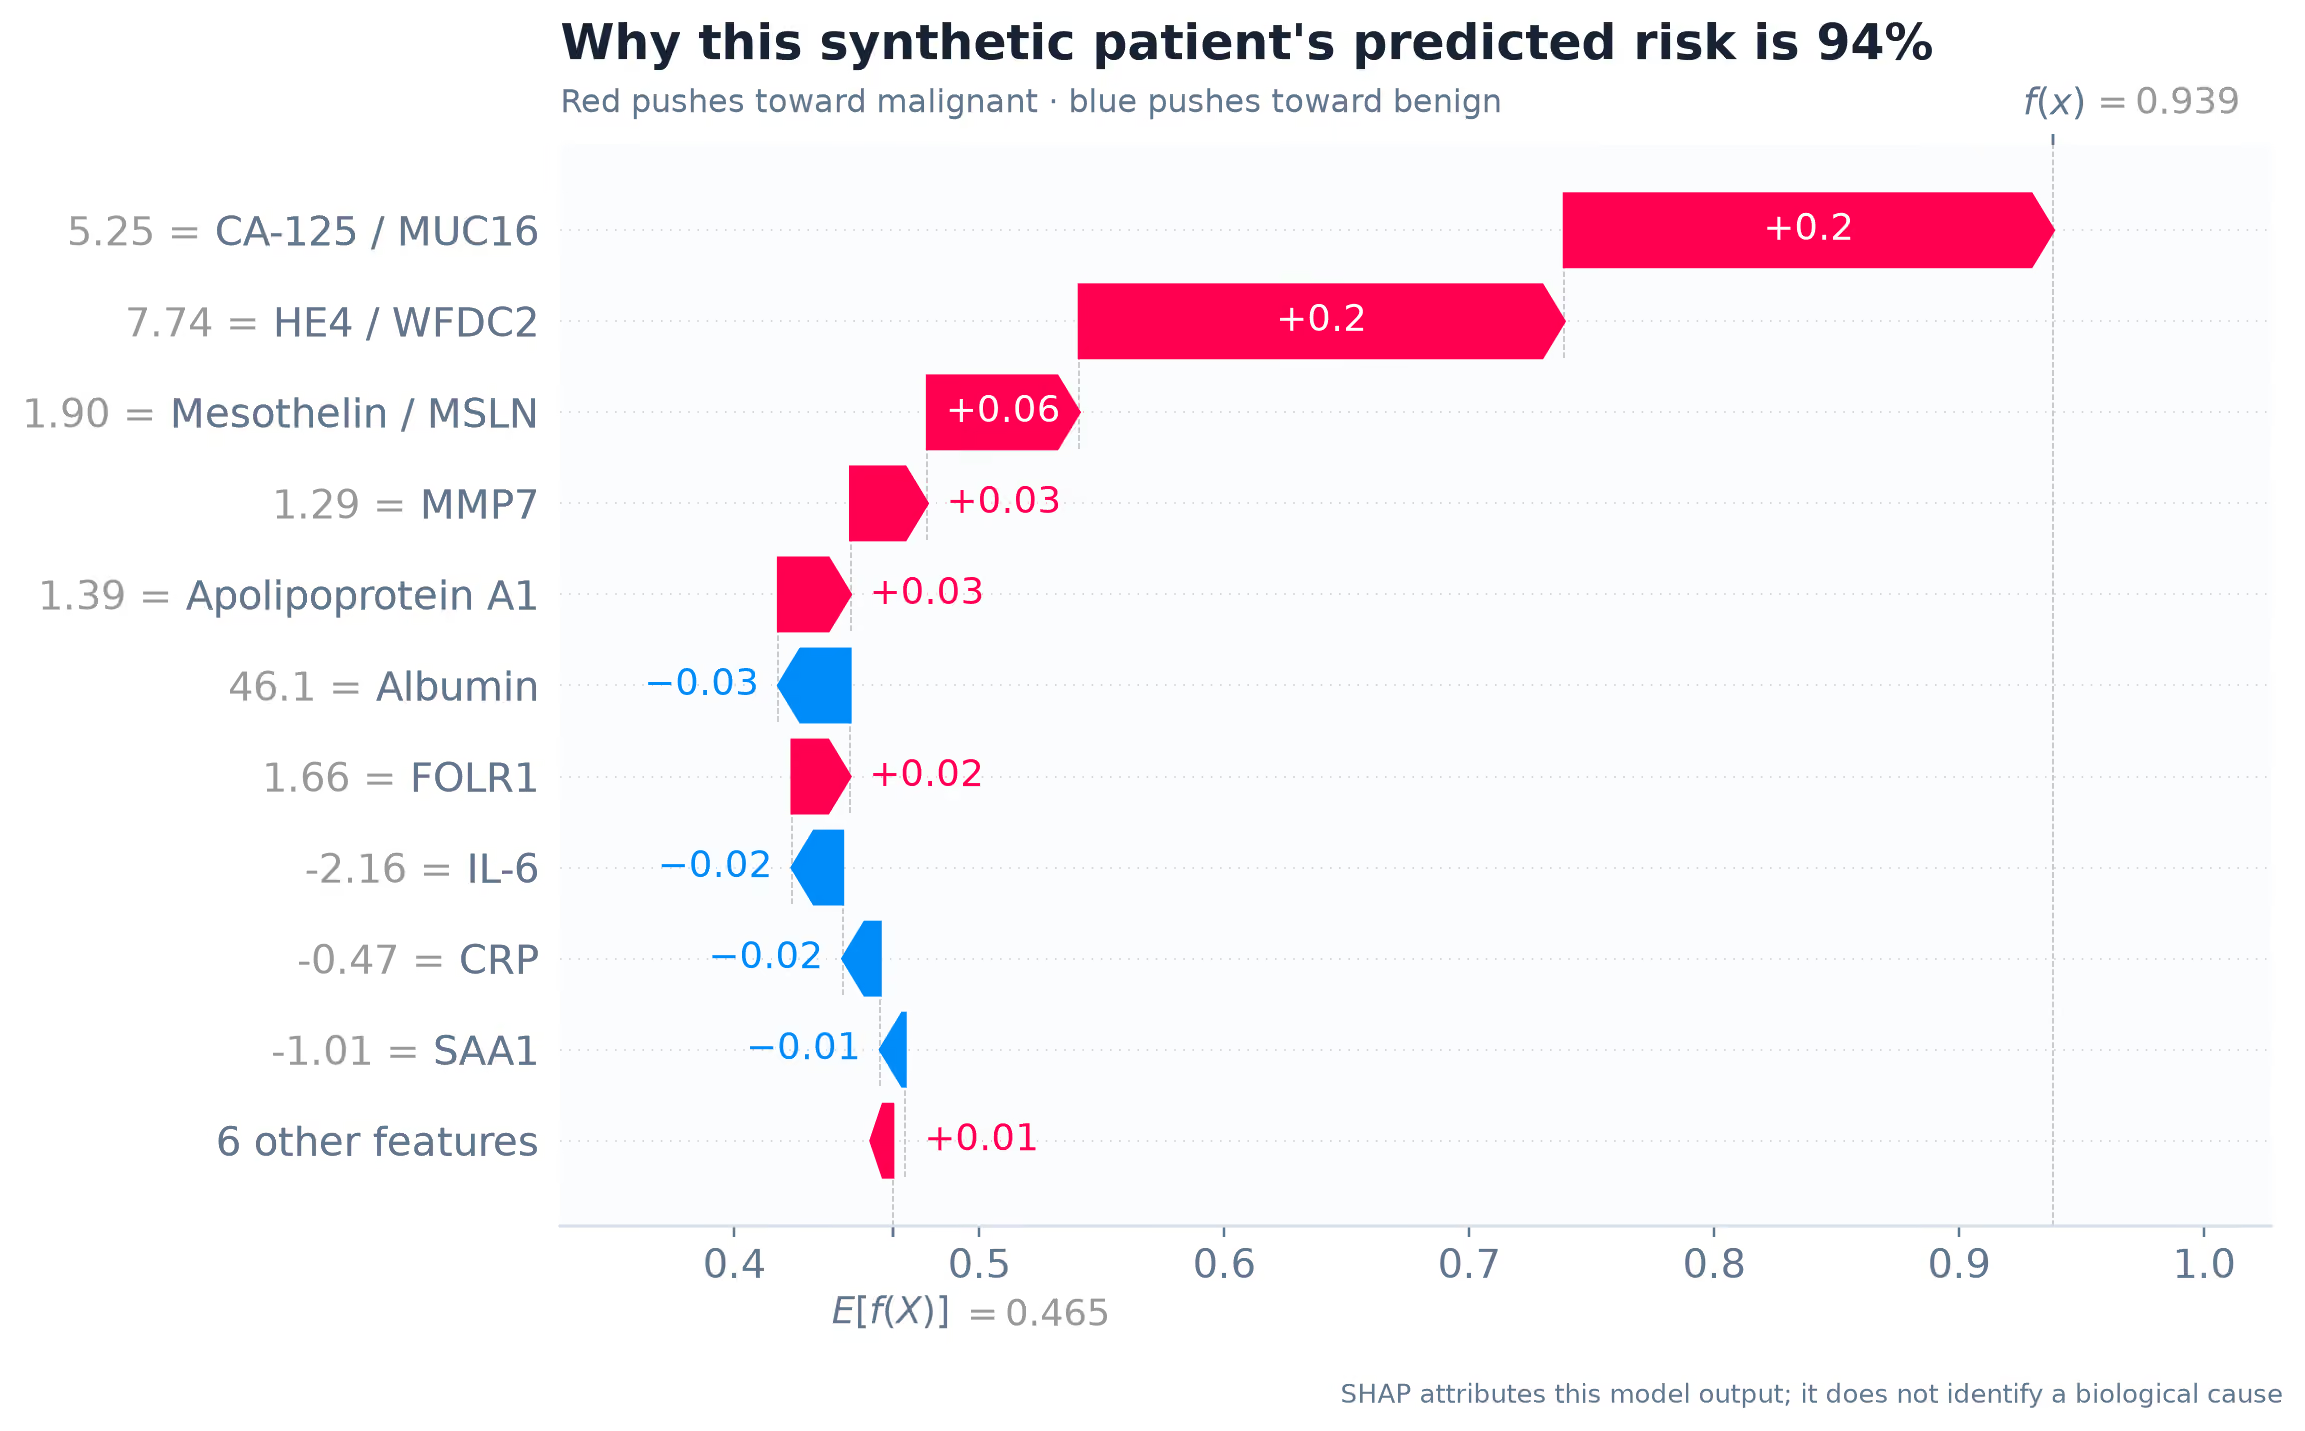
The two methods above provide high-level views of model behavior but do not directly explain an individual prediction.
For this, we can plot SHAP values for an individual prediction in a waterfall chart to see how different feature values contributed to the predicted probability.
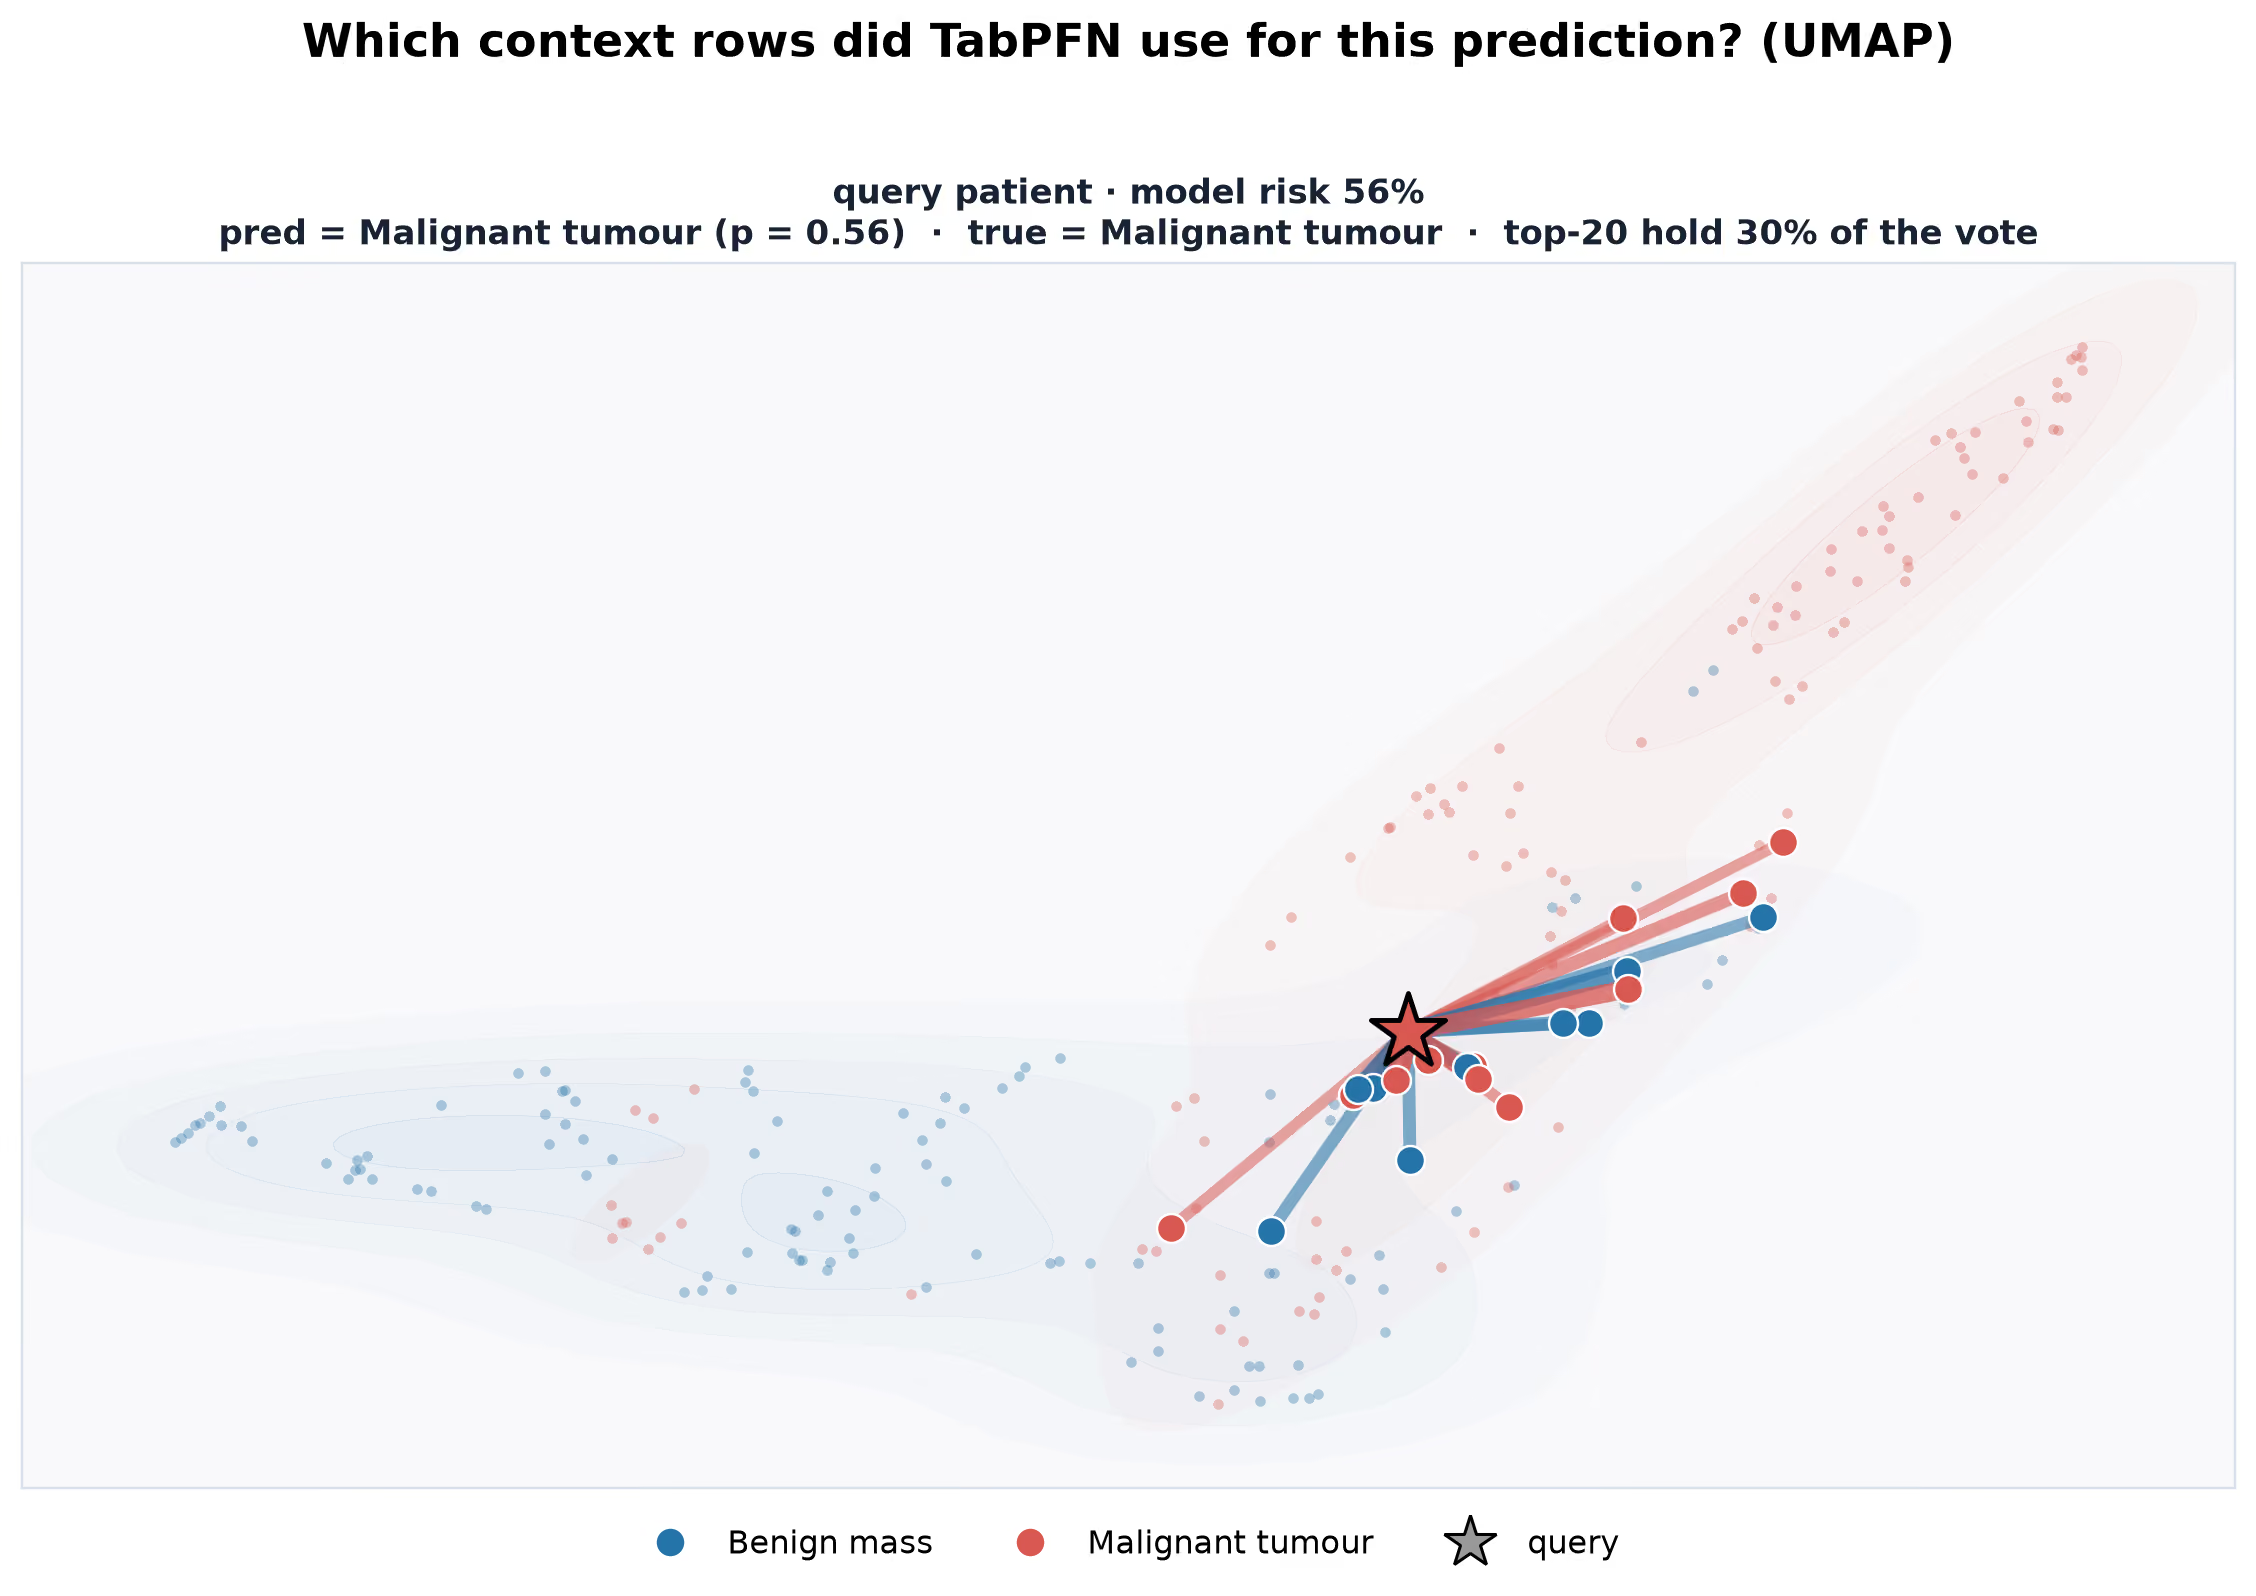
With TabPFN and in-context learning, we can go one step further. At inference time, TabPFN uses the context rows to generate a prediction for a query row. By inspecting TabPFN’s attention scores, we can see which context rows the model attended to when generating a given prediction. However, attention patterns do not necessarily provide a faithful explanation of the prediction:
Where to go from there?
As more decisions are supported by machine learning models, predictive performance alone is no longer enough. In proteomics, interpretability can help build better models, explain predictions, advance scientific research, and meet audit and regulatory requirements. Sounds interesting? Explore our interpretability documentation and try it for yourself!
